















Classroom ideas
Creativity
3 ways to use infographics in the classroom
April 25, 2019
clever


This article is part of a series that spotlights learning apps available in the Clever Library, a place where teachers can discover and adopt great apps for their classrooms through the Clever portal.
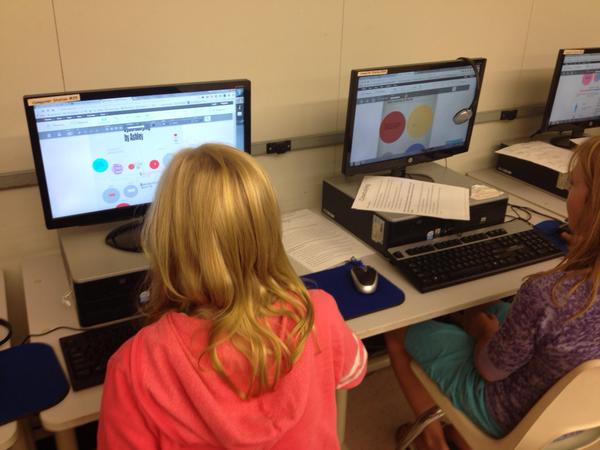
As an educator, you’ve already recognized the importance of visual literacy in promoting deeper learning. Plus, it’s engaging and fun for students and teachers alike. What’s even more impressive is that visual aids in the classroom can improve learning by up to 400 percent.
Easelly is a simple infographic creation maker that enables anyone to represent an idea visually. Its intuitive interface allows ease of use and offers many options for customization.
If you want to further improve visual literacy in the classroom through infographics, keep reading for simple, practical examples!
Use infographics to gauge student learning
Have you thought about asking students to create an infographic highlighting what they’ve just learned in class?
Infographics will teach students to focus on the most important takeaways of a lesson, course, or classroom activity. You’ll be surprised how each student interprets an idea or insight from your class using pictograms, charts, and infographics.
Use infographics as a tool for end-of-the-school-year reflections
Apart from keeping track of your lessons throughout the season or semester, you can use infographics in class for end-of-year reflections. For example, encourage students to share a book, lesson, or activity that they’ve enjoyed the most throughout the year through an infographic!
Use an infographic creation activity to help students sharpen their research skills
Making infographics from scratch in your class isn’t just about creativity. It’s also an excellent way for them to improve their research chops. As part of an infographic creation session in class, encourage your students to ask better questions, find trustworthy information, and seek opposing views or perspectives.
Your turn!
Are you looking for more fun infographic activities in the classroom? These infographic creation resources are tailored specifically for classroom activities:
- Infographic Activity Book for Students (Free download)
- Why Are Infographics Effective in the Classroom? (Blog post with more examples)
- How to Make Infographics With Students (Video tutorial)
And if you’re ready to get those creative muscles going, start an infographic activity in class with Easelly, available in the Clever Library for free!

More to read
Districts
Teachers
August 3, 2026
District-Wide Defense: A Texas School District’s Successful Rollout of Student MFAEdinburg CISD needed to secure student identities across a 30,000+ Chromebook fleet—without overwhelming an already stretched IT help desk. With Clever's age-tiered MFA framework, the Texas district enrolled 99% of its 32,000 students within two months, virtually eliminating password reset tickets and empowering teachers to resolve credential issues in the classroom.
Districts
Global
Teachers
August 3, 2026
One Sync, Half a Million Students: TDSB’s Rostering TransformationCanada's largest school board needed a smarter, more secure way to manage student data across a growing suite of learning applications—without adding to its IT team's workload. With Clever, Toronto District School Board built a customized, application-level rostering model that automated data sync from PowerSchool, gave teachers class-level access, and strengthened data security for 500,000+ students and staff.
Districts
Teachers
July 7, 2026
Newcastle Grammar School Meets Essential 8 Compliance with Clever MFANewcastle Grammar School closed a long-standing MFA gap for students without personal devices by deploying Clever's visual authentication integrated with Microsoft Entra ID, reducing SOC security alerts and unlocking modern authentication features like Windows Hello and Face ID. The school can now confidently answer board and cyber insurance questions on MFA coverage, with plans to extend the program to Years 8–9 and beyond.