Diversity and inclusion report 2016
Over the past year, Clever has been working to move closer to our goal of creating and nurturing a truly diverse and inclusive company. As we said last year: “We know a lack of diversity is not a problem that can be solved, but rather a mission for equity that requires constant vigilance.”
Since we embarked on our mission, we invested time in understanding where we stand and where we can improve. Then we published this data in a series of blog posts focusing on our current numbers, survey pedagogy, and ways we’re working to move the needle on equity in our corner of the world. You can check out our past efforts here:
- 2015 demographic survey results
- How we designed our demographic survey
- Hiring recruiters who are committed to diversity
- Our relationship to our neighborhood community in San Francisco
We release these statistics and will continue to do so, year over year to:
- Continue to hold a spotlight on the lack of diversity in the technology industry and to share our incremental successes.
- Hold ourselves accountable as we work to improve diversity on our team.
- Encourage other companies to do the same. We’ll keep writing posts about what’s working for us—and what isn’t. We hope you’ll follow along and engage with us!
So where are we a year later? Below are the results of our 2016 demographic survey, which we administered in December 2016 across our employee base. (A tabular version of the data is also available). We plan to repeat this survey every year and continue to share our results.
GENDER
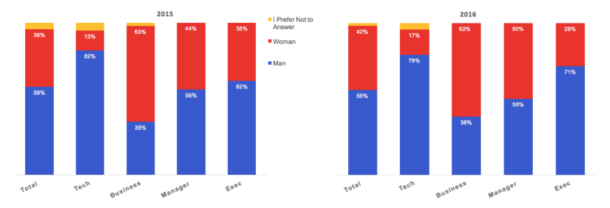
Our 2015 results showed that women were underrepresented on the Clever team, particularly in technical roles and in management. What we see today is, while men still outnumber women at Clever, the gap has begun to close in our total numbers.
There was a slight increase in the percentage of technical roles filled by women and a more significant increase in women in management. Despite men outnumbering women at Clever, in management roles, women and men are equally represented.
RACE AND ETHNICITY
The majority of our team identifies as white. There’s also a large Asian minority. Black, Latino or Hispanic, and multiracial employees, as well as employees of other races, make up about 20% of the team. Some racial groups, such as Native Hawaiian, are not represented at Clever.
Compared to 2015, the percentage of employees that do not identify themselves as white has increased overall, as well as in all sub-groups, with the exception of the executive team.

While gender and race are the most commonly reported demographic facets, we also wanted to measure other axes of difference that may cause employees to feel excluded, such as age, religion, sexuality, ability, and socioeconomic status and background.
AGE
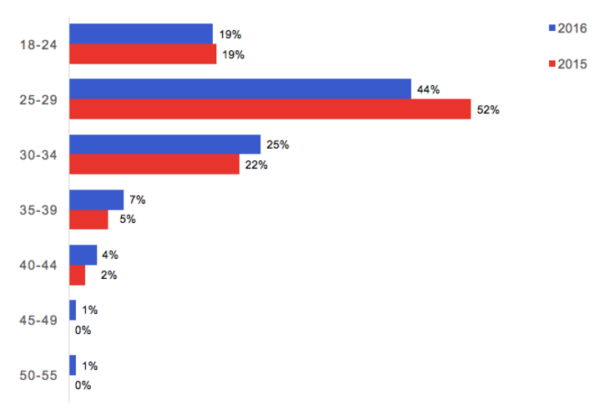
Clever skews younger than average when compared to the overall U.S. workforce, with the majority of the team under 30-years-old and no employees over 55.
RELIGION
The Clever team is largely non-religious, but there are groups of employees who practice many major U.S. religions. A notable exception is that no employees identify as Mormon.
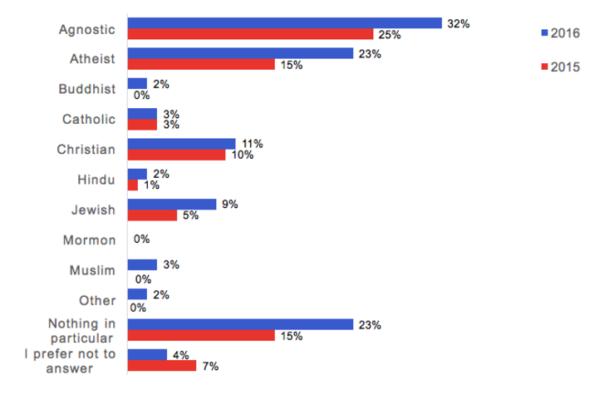
Total exceeds 100% because some respondents selected more than one option.
SEXUALITY
Clever’s team largely identifies as straight. Note that the non-straight sexuality results are aggregated to protect respondent anonymity.
- 87% Straight
- 13% Lesbian, gay, bisexual, queer, or asexual
- 1% Prefer not to answer
ABILITY
Clever’s team largely identifies as able.
- 88% No difficulty
- 10% Some difficulty
- 4% Prefer not to answer
PRIMARY CARETAKER OF A MINOR
A very small proportion of Clever employees are parents or caretakers of children.
- 94% No
- 5% Yes
- 1% Prefer not to answer
VETERANS
We have no one who reports being a veteran on our team.
- 99% No
- 0% Yes
- 1% Prefer not to answer
SOCIOECONOMIC BACKGROUND/EDUCATION ACCESS
Lastly, based on feedback from last year’s survey, we learned that our team felt that we were missing a question about socioeconomic background. We surveyed several aspects of socioeconomic background, including the level of education attained by each employee and the socioeconomic class each employee grew up in.
Most Clever employees report growing up middle-class.
- 4% Lower class
- 5% Working class
- 19% Lower middle class
- 50% Upper middle class
- 14% Upper class
- 7% I prefer not to answer
Almost all Clever employees report having earned a bachelor’s degree or higher.
- 2% Completed some college
- 68% Bachelor’s degree
- 28% Master’s, Ph.D., or other post-baccalaureate study
- 2% I prefer not to answer
WHAT’S NEXT
Over the next year, we’ll continue to share lessons we learn and stumbling blocks we run into as the Clever team grows.
Some topics we hope to cover:
- The top of the pipeline and sourcing for diverse talent
- Spotlight on women at Clever
- Thinking about diversity: Some do’s and don’ts
- Building a system that ensures equitable compensation
We’re looking forward to keeping you updated on our progress and efforts throughout 2017!

More to read
October 16, 2025
A Unified Future: Why a Single Identity Platform Is the Key to Secure and Scalable LearningStop managing complex K-12 security with patchwork fixes. Jamie Reffell, CPO at Clever explains how a unified identity platform is the future for secure, scalable learning and effortless edtech deployment.
December 17, 2024
Year in review: Inclusion and Belonging in 2024A snapshot of our learnings around inclusion and belonging for 2024 – our focuses, our progress, and where we need to improve.
