Diversity and inclusion report 2015
This post is the start of a series focused on diversity and inclusion. View all posts in the series.
As an education technology company, Clever sits at the intersection of two worlds—the world of schools and the world of silicon. Both the education system and the tech industry have long struggled to serve diverse groups and create inclusive environments.
From our vantage point, it’s easy to see that these two systems are intimately connected. Problems of equity and access for underprivileged groups start in schools and persist into the tech job market. The problems of one cannot be solved without tackling the problems of the other.
Clever’s products aim to increase equity in the school system by making it easy to use technology in any classroom. But building products to promote equity is not enough. As a tech company, we must also examine our position in an industry in which women, people of color, and other groups are consistently underprivileged. At Clever, we are committed to doing the difficult work that is necessary to help change our industry, starting with our own company.
There’s an old adage in the tech industry: You make what you measure. Rooted deep in the culture of tech is the idea that we solve problems best when we can measure the impact of our solutions. In other words, we are data-driven.
So when we think about improving diversity and inclusion at Clever, the first step in the process is to measure the makeup of our team. We’re not the first to take this approach. Today we join the ranks of tech companies releasing their employee demographic statistics publicly.
Why release these statistics? For a few reasons:
- To continue to raise awareness about the lack of diversity in the tech industry and to share our incremental successes. Avoiding or hiding the problem will not help solve it!
- To hold ourselves accountable as we work to improve diversity on our team. In a similar vein, we’ve signed the Kapor Capital Founders’ Commitment, a pledge to invest in creating a diverse and inclusive workplace and to contribute to our local community.
- To inspire other companies to do the same. We’ll share some tips for writing a demographic survey in a later post.
Below are the results of our 2015 demographic survey, which we administered in December 2015 across our employee base. (A tabular version of the data is also available for the visually impaired). We plan to repeat this survey every year and continue to share our results.
Gender
Men outnumber women at Clever, and the proportion of women in leadership roles matches that ratio. Women are vastly underrepresented in technical roles.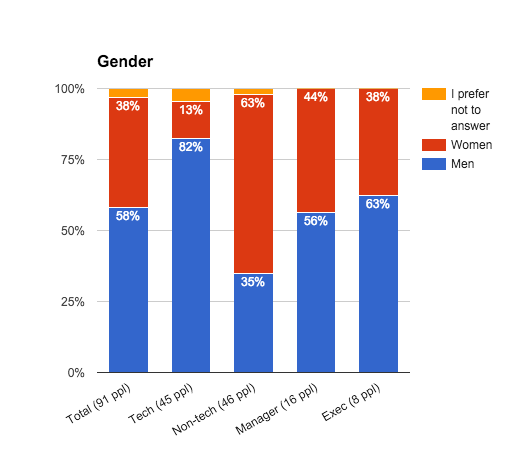
Race
The majority of our team identifies as white. There’s also a large Asian minority. Black, Latino, and multiracial employees make up a small sliver of the team. Other racial groups, such as American Indian and Native Hawaiian, are not represented.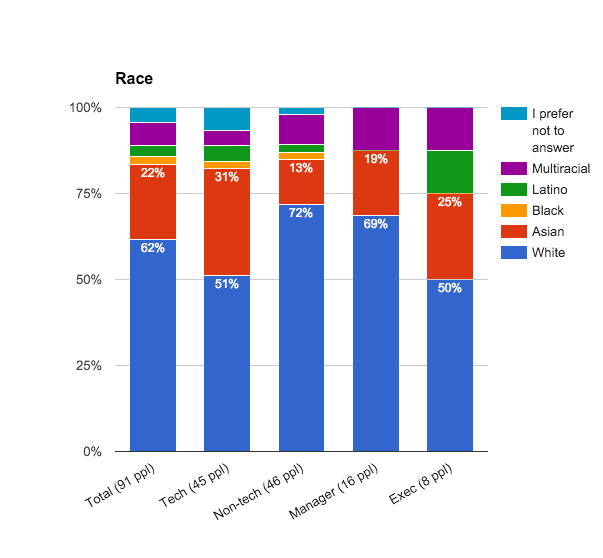 While gender and race are the most commonly reported demographic facets, we also wanted measure along other axes of difference that may cause employees to feel excluded, such as age, religion, sexuality, and ability.
Age
Clever skews younger, with the majority of the team under 30 and no employees over 45.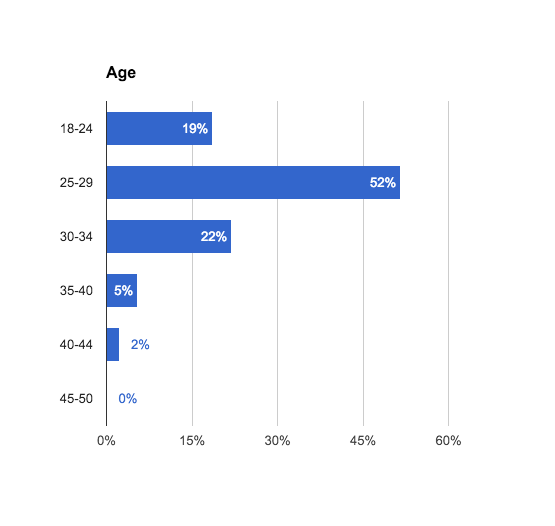
Religion
Clever has a mostly non-religious team, but there are groups of employees who practice many major U.S. religions. No employees identify as Muslim, Buddhist, or Mormon.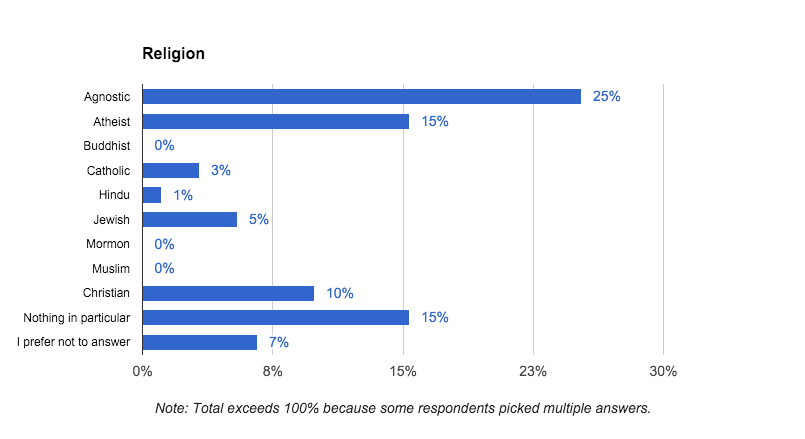
Sexuality
Clever’s team largely identifies as straight. Note that the non-straight sexuality results are aggregated to protect respondent anonymity.
- 87% straight
- 7% lesbian, gay, bisexual, queer, or asexual
- 7% prefer not to answer
Ability
Clever’s team largely identifies as able. This question had the largest proportion of respondents choosing not to answer.
- 88% no difficulty
- 3% some difficulty
- 9% prefer not to answer
Primary Caretaker of a Minor
A very small proportion of Clever employees are parents or caretakers of children.
- 93% no
- 3% yes
- 3% prefer not to answer
Veterans
Last, we have a very small veteran population on our team.
- 95% no
- 2% yes
- 3% prefer not to answer
Based on additional feedback from the survey, we learned that our team felt that we were missing a question about socioeconomic background. We intend to include this in our next survey.
What’s Next
Currently, we’re combining the results of our demographic survey with the results of our employee happiness survey to identify areas where we can be more inclusive. We’re also using our demographic numbers to benchmark our recruiting efforts.
Based on the results of our survey, we know we have further to go towards creating a truly diverse and inclusive company. In fact, we know a lack of diversity is not a problem that can be “solved,” but rather a mission for equity that requires constant vigilance.
In a forthcoming series of blog posts, we’ll be sharing some of the lessons we’ve learned and challenges we’ve faced in the past three years, including:
- How we designed our demographic survey
- Hiring recruiters who are committed to diversity
- Creating a referral policy to combat exclusive hiring network effects
- Our relationship to our neighborhood community in San Francisco
- Tactics for building grassroots awareness of diversity and inclusion issues
We are one small voice in a larger, industry-wide conversation about equity. We hope you’ll follow along and engage in this conversation with us!

More to read
December 18, 2025
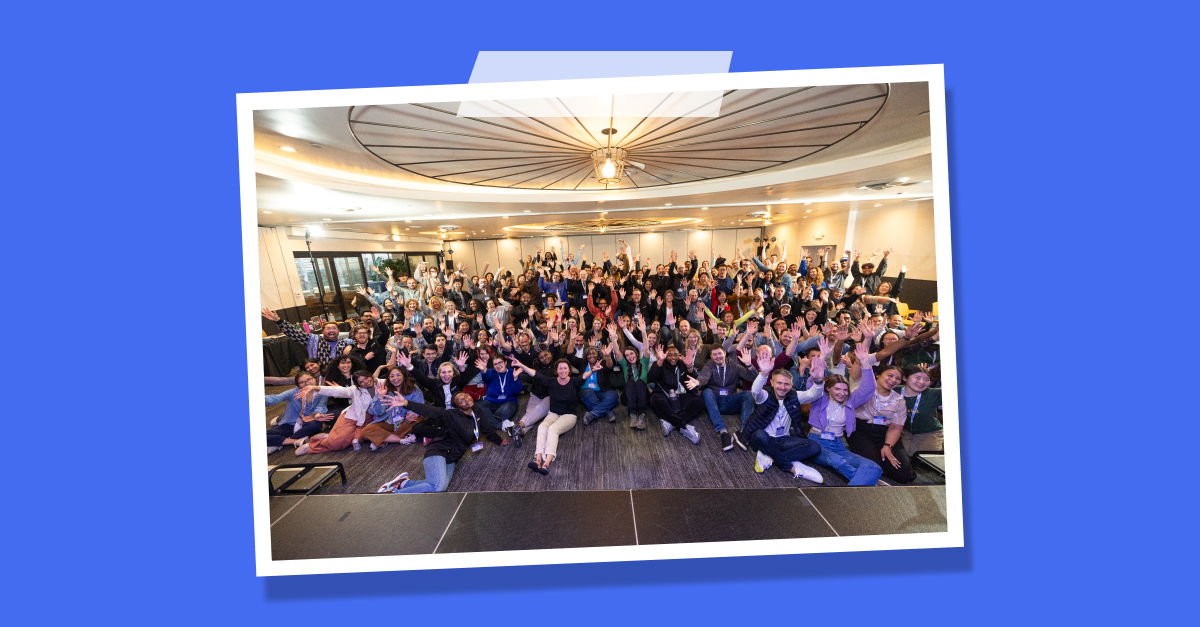
2025 Year in Review: Inclusion and Belonging at CleverClever is proud to share that representation across our workforce continues to reach new milestones, including record levels in technical roles and for Black and Latinx employees. We are continuing to build on this foundation by investing in an inclusive employee experience that supports retention, development, and high performance across all teams and locations.
October 16, 2025
A Unified Future: Why a Single Identity Platform Is the Key to Secure and Scalable LearningStop managing complex K-12 security with patchwork fixes. Jamie Reffell, CPO at Clever explains how a unified identity platform is the future for secure, scalable learning and effortless edtech deployment.
December 17, 2024
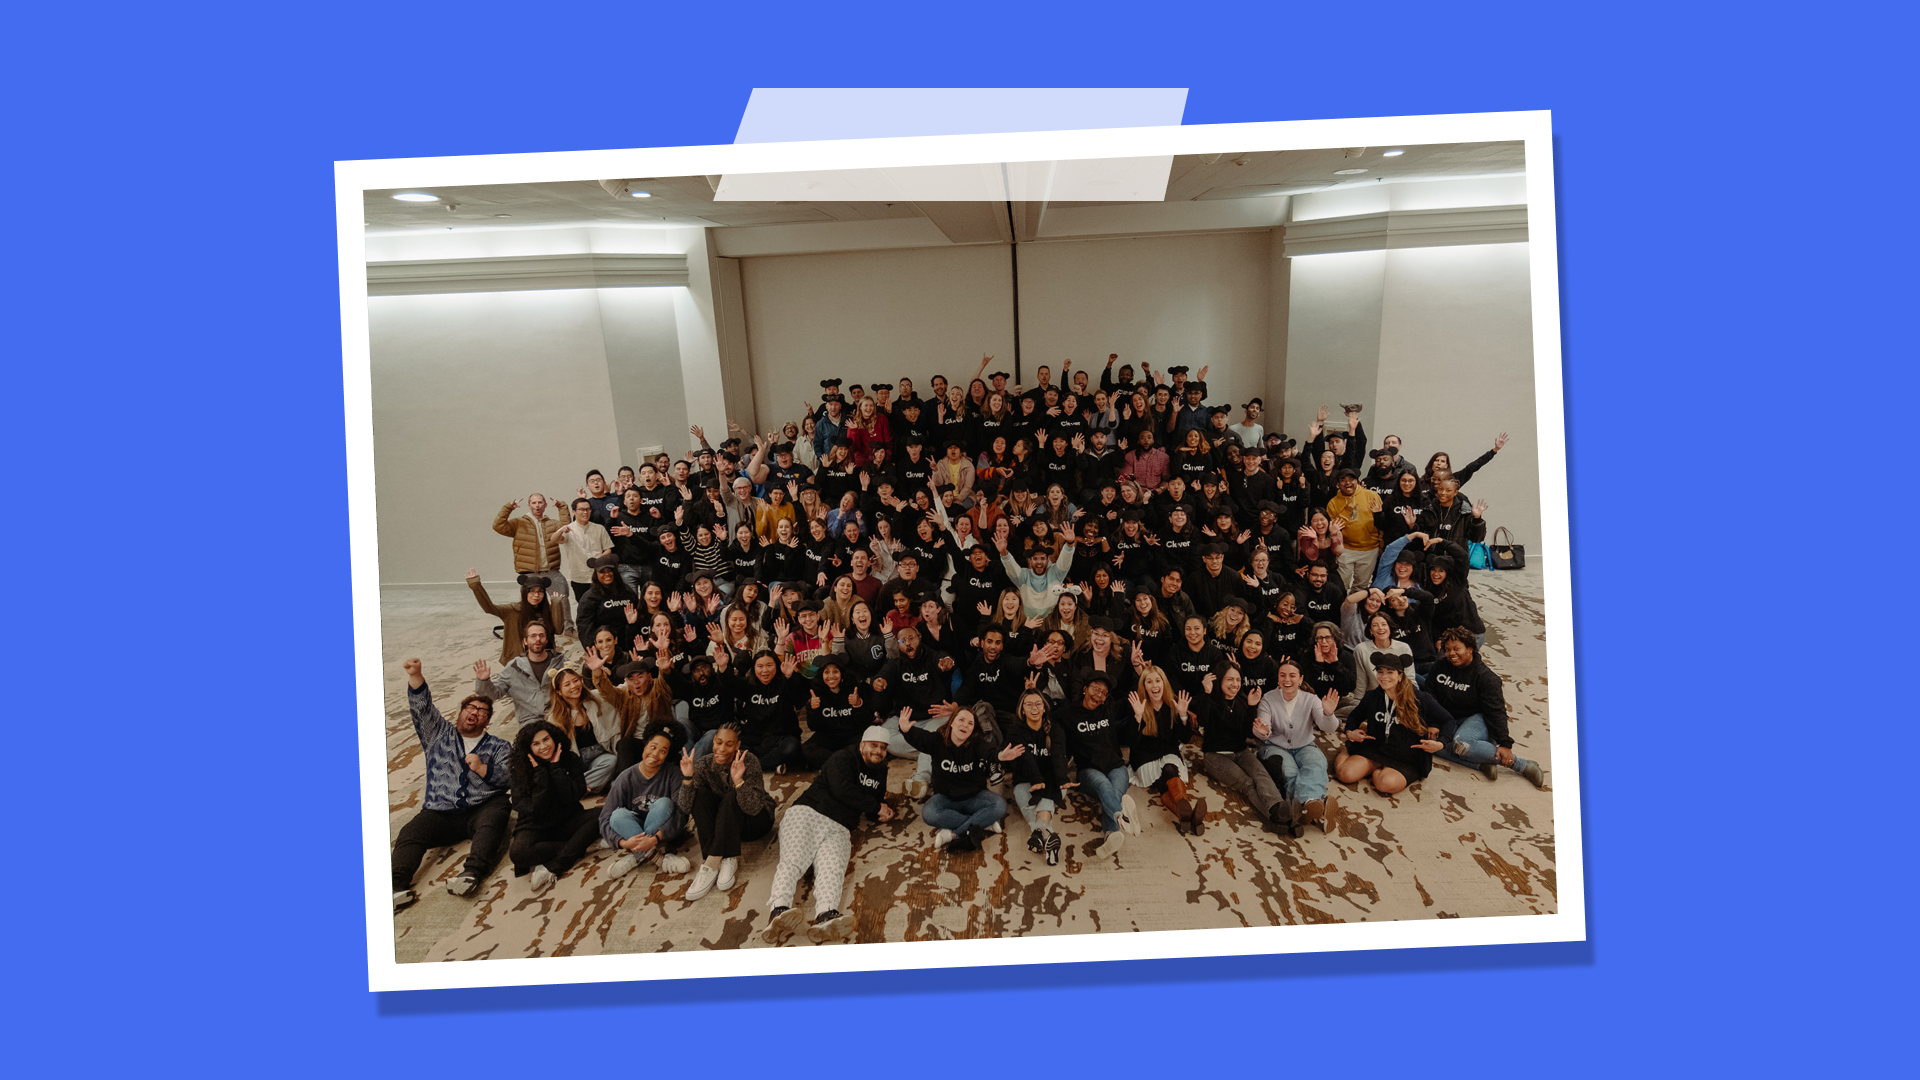
Year in review: Inclusion and Belonging in 2024A snapshot of our learnings around inclusion and belonging for 2024 – our focuses, our progress, and where we need to improve.


